An INTRODUCTION to GERMANISCHE HEILKUNDE®
by Dr. med. Ryke Geerd Hamer
Bronchial carcinoma was re-named lung cancer

Picture: Smoking cigarettes and lung cancer are definitely linked. But because of the long time span between increased cigarette consumption and increased incidence of lung cancer, the relationship remained unclear for a long time. These data came from England and Wales. Among the male population (black symbols), smoking increased at the beginning of the 20th century, but the corresponding increase in the number of lung cancer deaths could not be observed before 1920. Women (coloured symbols) started smoking much later and lung cancer is only now becoming more frequent among them. (the graph in colour could not be scanned)
These comparative graph diagrams are very revealing: their intent and purpose is very clear, demonstrating at all costs that smoking does cause cancer. The investigations by Dontenwill et al. „Untersuchungen über den Effekt der chronischen Zigarettenrauch-Inhalation beim syrischen Goldhamster und über die Bedeutung des Vitamin A auf die bei Berauchung gefundenen Organveränderungen“, Z. Krebsforschung 89, 153-180 (1977) [“Inquiry into the effect of chronic cigarette smoke inhalation on Syrian Golden Hamsters and on the significance of vitamin A on the organ changes found after forced smoke exposure” 1977] are facts:
of 6.000 hamsters exposed to smoke all their lives, none of the animals developed bronchial cancer and none of them developed lung alveolar cancer. These facts are being made to fit the statistics in order to be able to come to the conclusion that smoking nevertheless causes cancer. This result is arrived at with recourse to several hypotheses that make it plausible:
1. Bronchial cancer will no longer be considered; the name has become “lung cancer”. However lung cancer is:
a) Bronchial ulcerating squamous epithelium carcinoma always discovered in the pcl-phase as “atelectasis”.
b) Alveolar adeno carcinoma, also named pulmonary (lung) nodules, which is detected in the conflict active phase. In the pcl-phase, if acid-fast rod-shaped bacteria are available, this becomes lung tuberculosis.
c) Intra-bronchial goblet cell adeno-Ca, evident only in the conflict active phase or when no acid-fast rod-shaped bacteria are available in the pcl-phase. Should this particular bacteria (TB) be there, the (very small) Carcinoma caseates as tuberculosis.
d) Mesotheolioma of the pleura, which is not commonly noticed in the ca-phase, in the pcl phase with TB: Pleura TB, thickening of skin; without TB, so-called carcinomatoid pleural effusion.
e) Mediastinal pharyngeal-arch-duct ulceration, retrocardial, squamous epithelium ulceration. In the pcl-phase, pharyngeal arch duct cysts. With several relapses there is induration of the so-called centrocytic-centroblastic Non-Hodkin’s lymphoma.
f) Retrosternal euthyreote, mediastinal, precardial thyroid-duct-squamous epithelium (only in the pcl-phase) struma.
The hypothesis is that all of these tumors have something to do with smoking. Yet the cigarette smoke only reaches as far as the bronchi, practically not even into the alveoli. Not knowing about the second biological law, the “tumors” are not even definded. The ca-phase tumors are misinterpreted as pcl-pseudo-tumor; residual states of blocked TB and TB itself. The results can only cause confusion!
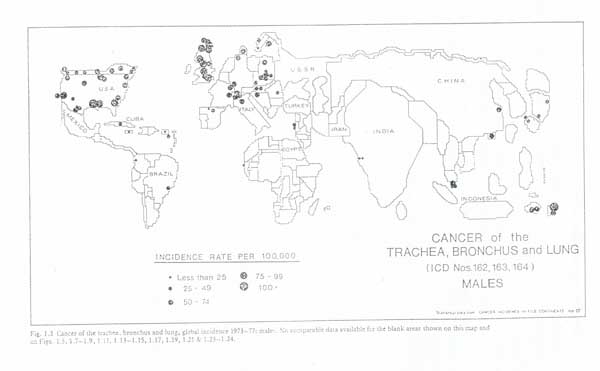
2. The connection between cancer and tuberculosis is not considered. Oddly enough, no one has noticed that with the decline of TB, there has been an increase in pulmonary (lung) nodules, In India, for instance, (e.f. next illustration) there are fewer than 25 “lung cancer” incidents per 100,000 inhabitants. In Europe, on the other hand, it is up to 100 cases (valid for men). However, India has 20-50 times the incidence of lung tuberculosis.
3. A hypothetical period of latency is arbitrarily constructed, as if it took 20 years for the effect of cigarette smoke to become effective. This trick allows the holding of today’s unexplainable facts at bay for a little while longer, sinde they only need to be explained in twenty years.
Back to our diagram:
while the increase in lung cancer between 1920 and 1940 is quite possibly tied firstly to an improvement in X-ray diagnosis and presumably includes cases of bronchial atelectasis, from 1940 on there were improved diagnostic techniques and suppression of tuberculosis. It is curious that the graph stops around 1970/72, because additional phenomena are difficult to explain, because the consumption of cigarettes declines from 1970 on. Actually, the incidence of so-called lung cancer should also have decreased if it were caused by smoking. This is not the case.
Another mistake is not considering the age pyramid. Old people suffer a much higher incidence of bronchial cancer and pulmonary nodule carcinoma than the young. We only count the incidence of lung cancer in a given population unit in a given time unit, even though there has been a significant increase in life expectancy and we simply say that it has increased. For the mass of those between 65 and 85 we have an insignificant group to compare with!